From pixel to situational picture.
Atlas combines satellite imagery, maps and sensor streams into a traceable spatial situational picture. What used to exist as isolated pixel layers becomes a harmonised view of space — with source, confidence and audit trail behind every statement.
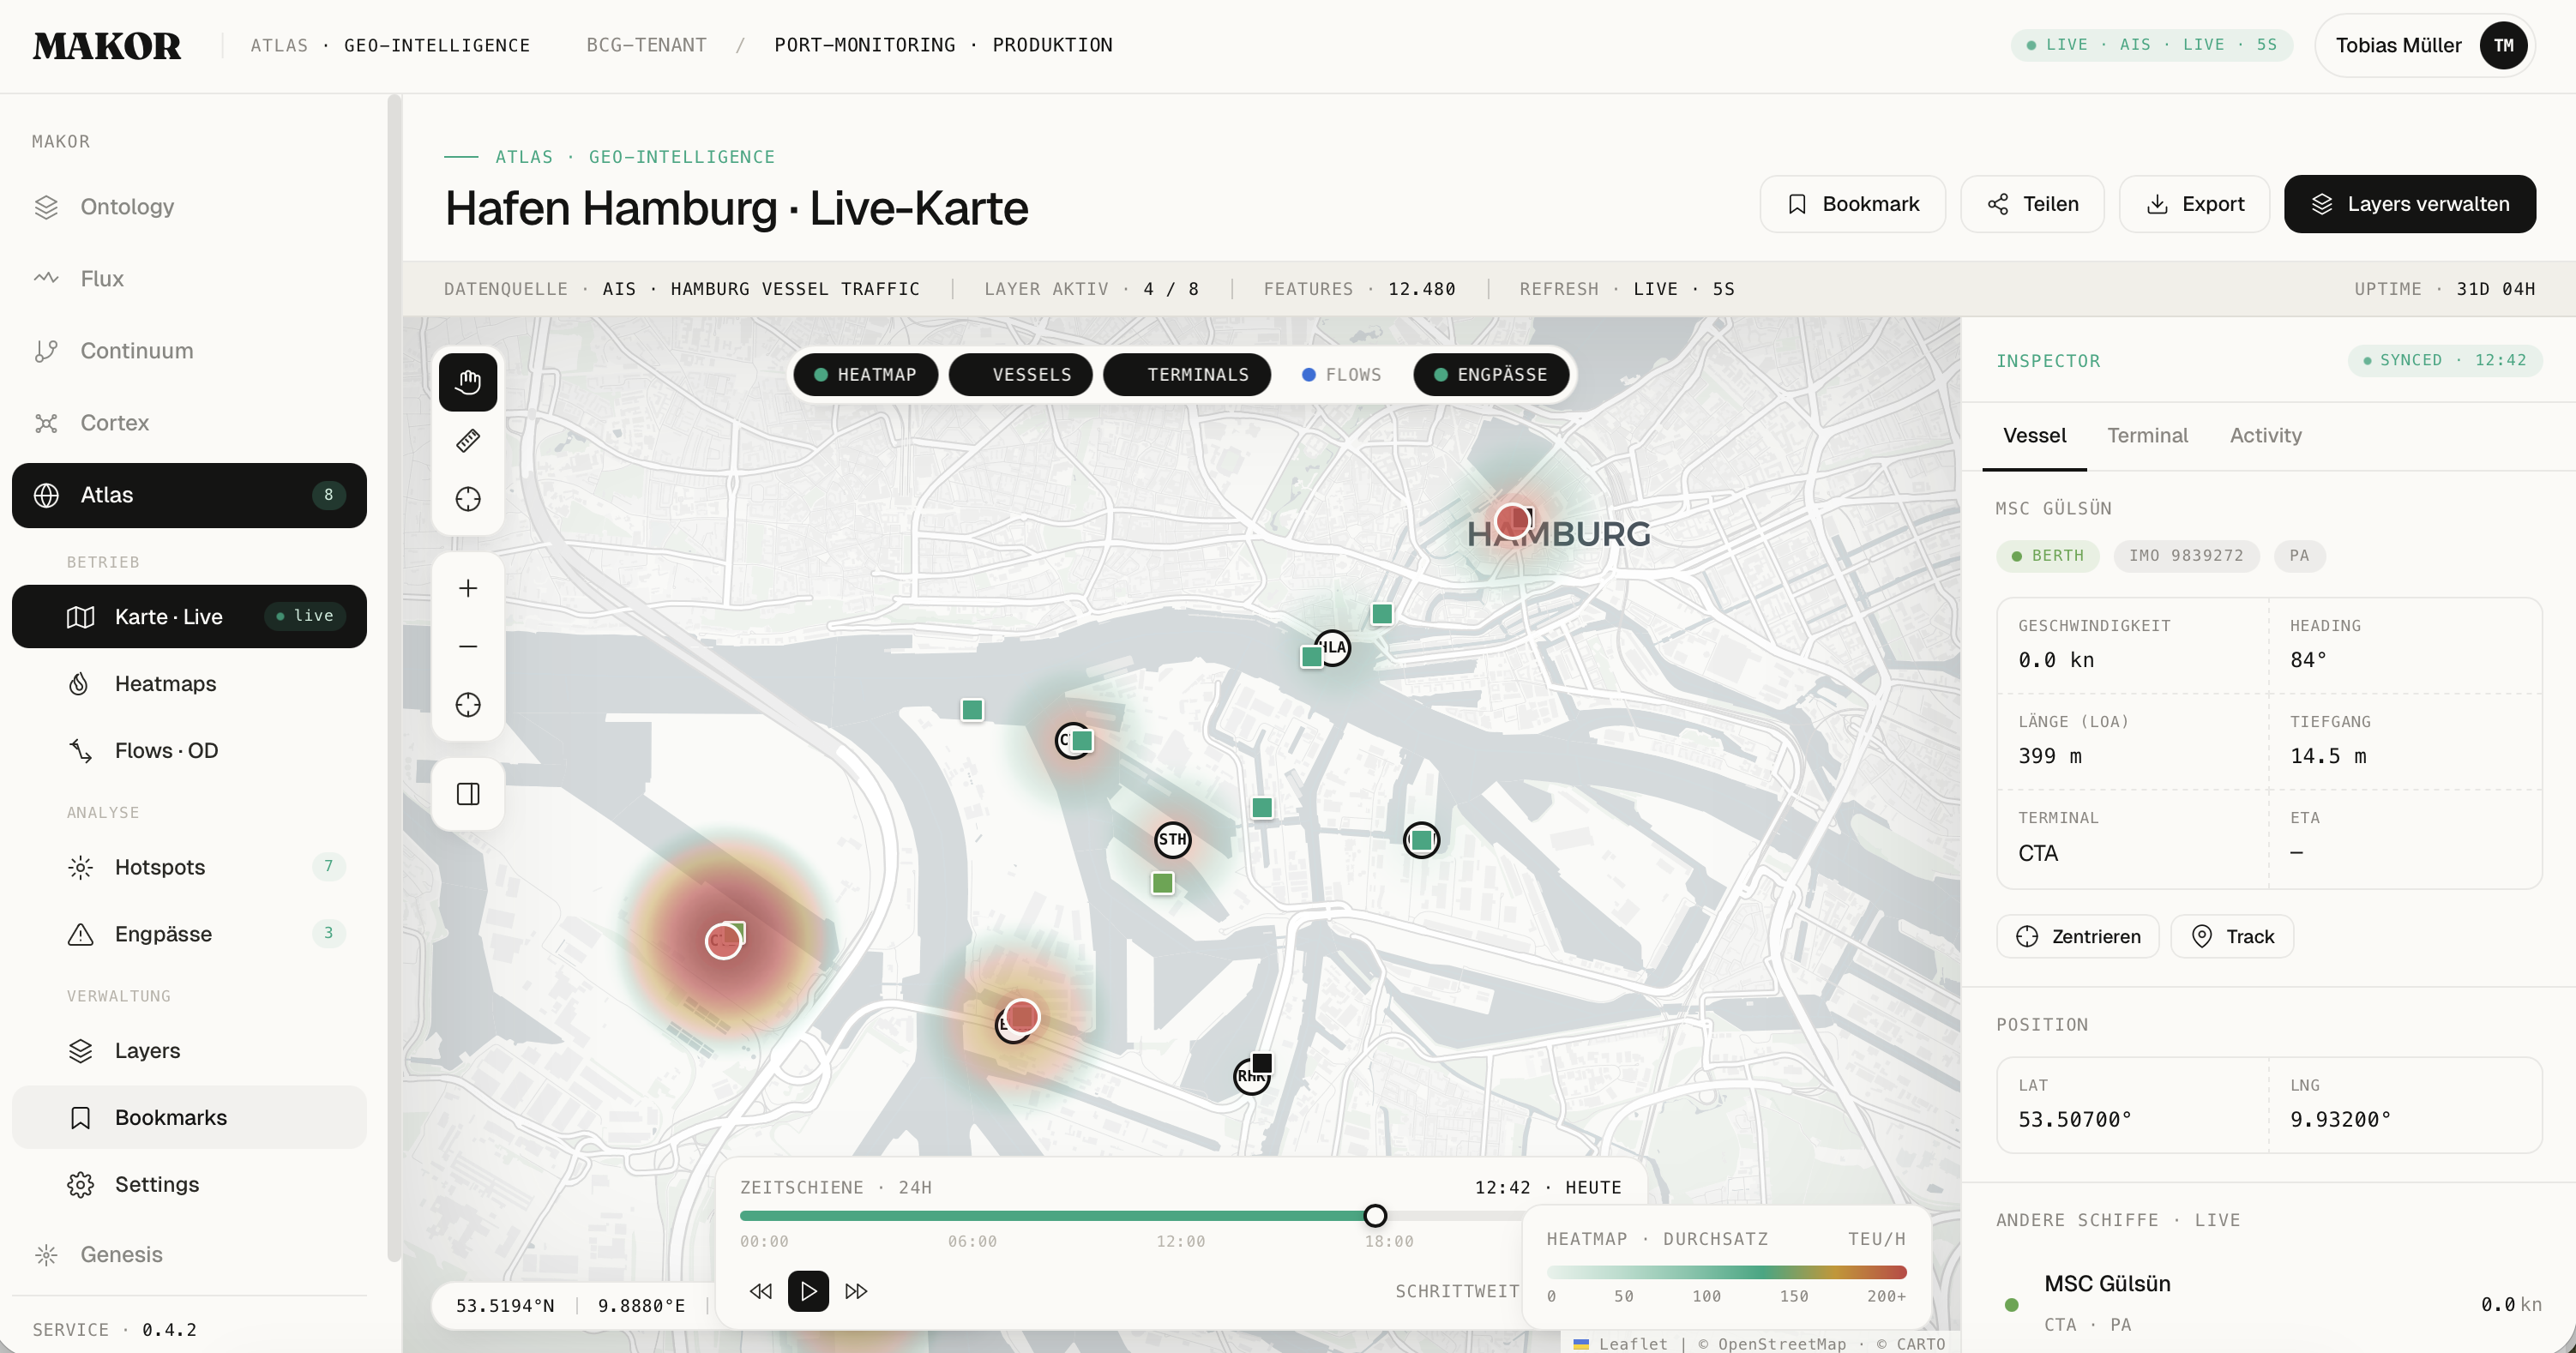
The sketch illustrates the principle: Atlas lays hypotheses, confidence levels and sources over space. What this looks like in your application depends on the use case.
Where Atlas makes an impact today.
Four concrete fields in which Atlas creates the spatial situational picture — by way of example, not exhaustive. Every pilot is tailored to your data sources, workflows and sovereignty requirements.
Automatically detect changes along routes, pipelines or substations — before the damage, not after. Multispectral difference instead of manual visual inspection.
Build a live situational picture from floating-car data, sensors and map base data that marks bottlenecks as hypotheses with source and confidence — even where sensors fail.
After storms, floods or fires: affected areas, accessible routes and prioritised deployment points from heterogeneous sources — in hours instead of days.
Merge inventory data, satellite imagery and municipal vector maps into a harmonised planning view — sealing, vegetation and development in one situational picture.
Movement and surface patterns along defined corridors from sensor and image sources — on sovereign infrastructure, with a traceable audit trail for every finding.
Vegetation index, water levels and air quality as spatial trends — with anomaly detection that compares individual stations with the overall picture.
Space is only one dimension.
Atlas becomes more powerful once relationships and time are added. All modules share the same Äther — without duplicating data.
Pilot in 6 weeks — on your data, in your environment.
We start with a clearly defined use case. You keep your data, models and audit logs. Atlas runs on-premise, in your private cloud or on a European PaaS.